What, When and How of Big Data Visualization
What is VISUALIZATION?
Data visualization is the visual representation of information by the use of graphs, charts, maps and other graphical diagrams. It is an imagery representation of data, making it easily understandable and gain insights from it.
How IMPORTANT is it?
Data visualization may often be depicted as just “pretty pictures” because for most people, it is easier to look at the pictures than to actually read the content/data and extract information from it. But actually, it facilitates the discovery and communication of data at the same time and yields insights for the researchers. Also, the work on “Viziometrics” [1] says that more richly illustrated journal articles have higher citation counts. So, open source and modular softwares are needed at many stages of inquiry.
Due to its applications in fields like astronomy, medicine, and geographical information science, the leaders in technology and science are coming to realize the payoff that training in data visualization can bring, both in terms of new scientific insight, as well as improved communication, both among experts, and with the public.
Where does the “BIG” data come in?
As the size and complexity of the data sets increased over the past few decades, the modern ramp-up in data scale made visualization a challenge. Although today, we have the best tools to produce visualizations of quality high enough for both scientific insight and public outreach, most of them are confined to simpler and smaller amounts of data.
Understanding the Exploratory-Explanatory Bias
Earlier, it was a preconceived notion of the professional scientists that beautiful graphics are “only for the public” and not worth the time they take to create. Thus, the data visualization was treated like some exploratory graphics, for which non-technical people were employed, and some do-it-yourself tools were used to make visualization that accompany scholarly publications and teaching materials. But, since the research of the scientists was purely technical, they were treated to be “explanatory”, that is, it contained proper research-based content and detailing whose intended audience was only scientists and researchers. [2]
Visualization over Text: Breaking the bias!
While responding to the presence of large databases, the visualizations might be desirable over texts. Knowledge discovery in databases (KDD) is a process to find new knowledge from databases where dimension, complexity or amount of data is prohibitively large for human observation alone.
These days, visualization is seen as an interactive process requiring human knowledge coupled with the computational efficiency of modern computer technology. (e.g. [3])
This has led to dramatic improvements in both software and computing, making the gap between exploration and explanation very short.
GLUE visualization environment:
GLUE is a commonly used Python library to explore relationships within the datasets. Glue also offers an application with highly enhanced Graphical User Interface for those users who are not interested in writing Python code for data visualizations.[4] The GLUE Python library, as well as the GLUE software provide us certain ways of visualization that help in the creation of highly customizable, flexible and connective linked-view of data.
We can instal GLUE with the help of following command:
pip install glueviz[all,qt]
Some of the plugins provided by the same are as follows:
-
glue-vispy-viewers (for 3d views)
-
glue-plotly: plotly exporter for glue (for exporting the plots made in GLUE)
Because of its strong base in Python, it becomes an intermediate layer between explainers and the explorers, particularly in the field of astronomy.[4] It also provides us separate plugins for Medical Imaging, Geosciences, and Astronomy. It works on exploiting the logical links that exist in different datasets. The figure below is a pictorial representation to show a high-level visuals provided by Glue for the astronomical data. [5]
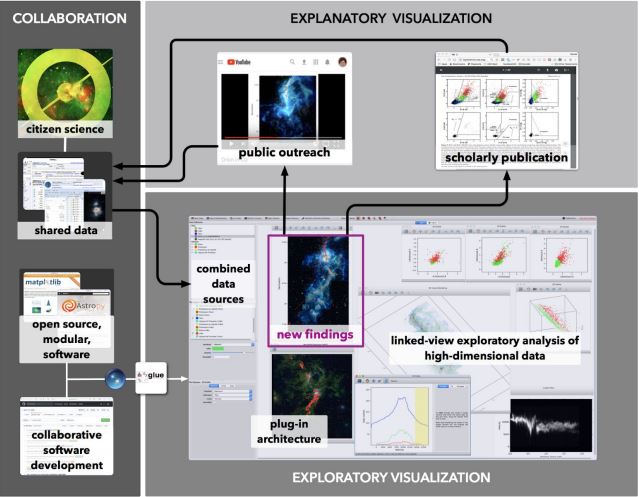
Figure 2: Glue environment in astronomy
Conclusion:
In this blog, we have tried to explain that there is no longer a gap between exploratory and explanatory work with the growth in data and evolution in softwares. So, it would be beneficial to look for some new, more mutually understandable, tools for big data visualization.
Generally, scientists of particular disciplines (for example, Geoscience or neuroscience) find it hard to “undiscipline” themselves to be able to intervene with the huge amount of data available to them. Also, different visuals may have different level of comfort associated with people of different domains. So, the purpose of visualization tools and technologies is to provide them super-flexible visuals out of the heterogeneous data.
Hence, we have discussed about Glue Python library and the GLUE software. It has a well-defined Python base and features. It helps to move Exploratory Data into a visual representation where the kinds of real-time interactions can be done over the data associated with medical and astronomical field. The detailed description about GLUE can be found from its official website. [4]
Big data visualization opens a whole new field of research for the scientists as every field of work, ranging from businesses to science, require a generalized view of data available to them. And we need tools and methods for optimizing the process of visualizations, especially when the data is growing rapidly. Thus, for researchers, considerable improvements in terms of visualization is very likely to improve proficiency of work.
REFERENCES:
[1] Lee PS, West JD, Howe B (2018) Viziometrics: Analyzing Visual Information in the Scientific Literature. IEEE Transactions on Big Data 4(1):117–129.
[2] Goodman A, Çöltekin A The 10 Questions to Ask When Creating a Visualization. 10QViz. Available at: http://10qviz.org/ [Accessed May 19, 2018].
[3] Beaumont CN, Goodman A a., Kendrew S, Williams JP, Simpson R (2014) the Milky Way Project: Leveraging Citizen Science and Machine Learning To Detect Interstellar Bubbles. Astrophys J Suppl Ser 214(1):3